Classification of SVD-mapped Datasets
Demonstrate the usage of a dataset mapper performing data projection onto singular value components within a cross-validation – for any classifier.
from mvpa2.suite import *

if __debug__:
    debug.active += ["REPM"]

#
# load PyMVPA example dataset
#
dataset = load_example_fmri_dataset(literal=True)

#
# preprocessing
#

# do chunkswise linear detrending on dataset
poly_detrend(dataset, polyord=1, chunks_attr='chunks')

# only use 'rest', 'cats' and 'scissors' samples from dataset
dataset = dataset[np.array([ l in ['rest', 'cat', 'scissors']
                    for l in dataset.targets], dtype='bool')]

# zscore dataset relative to baseline ('rest') mean
zscore(dataset, chunks_attr='chunks', param_est=('targets', ['rest']), dtype='float32')

# remove baseline samples from dataset for final analysis
dataset = dataset[dataset.sa.targets != 'rest']

# Specify the class of a base classifier to be used
Clf = LinearCSVMC
# And create the instance of SVDMapper to be reused
svdmapper = SVDMapper()
Lets create a generator of a ChainMapper which would first perform
SVD and then subselect the desired range of components.
get_SVD_sliced = lambda x: ChainMapper([svdmapper,
                                        StaticFeatureSelection(x)])
Now we can define a list of some classifiers: a simple one and several classifiers with built-in SVD transformation and selection of corresponding SVD subspaces
clfs = [('All orig.\nfeatures (%i)' % dataset.nfeatures, Clf()),
        ('All Comps\n(%i)' % (dataset.nsamples \
                 - (dataset.nsamples / len(dataset.UC)),),
                        MappedClassifier(Clf(), svdmapper)),
        ('First 5\nComp.', MappedClassifier(Clf(),
                        get_SVD_sliced(slice(0, 5)))),
        ('First 30\nComp.', MappedClassifier(Clf(),
                        get_SVD_sliced(slice(0, 30)))),
        ('Comp.\n6-30', MappedClassifier(Clf(),
                        get_SVD_sliced(slice(5, 30))))]


# run and visualize in barplot
results = []
labels = []

for desc, clf in clfs:
    print desc.replace('\n', ' ')
    cv = CrossValidation(clf, NFoldPartitioner())
    res = cv(dataset)
    # there is only one 'feature' i.e. the error in the returned
    # dataset
    results.append(res.samples[:,0])
    labels.append(desc)

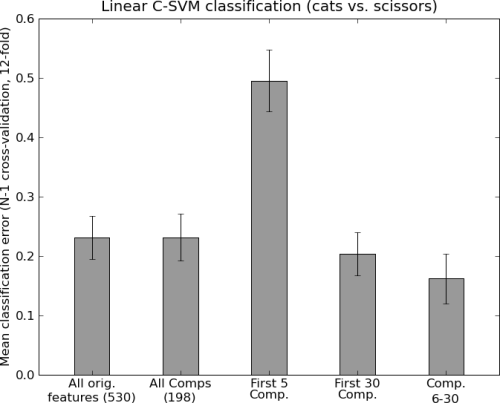
plot_bars(results, labels=labels,
         title='Linear C-SVM classification (cats vs. scissors)',
         ylabel='Mean classification error (N-1 cross-validation, 12-fold)',
         distance=0.5)
Output of the example analysis:

See also
The full source code of this example is included in the PyMVPA source distribution (doc/examples/svdclf.py).


